The Project Status Dashboard presents permission-based detail about the Project Status.
Remember: When you select one (1) or more Protocol options via the filter menu, the data is reflected in a single tile at top of the screen (Average Days from User Access…), plus the Selected Outcomes tile, and Average Days from User Access Granted to Training Module Completed tile. Other metrics including the KPIs and Percent of Budget Consumed data is not affected by the Protocol selection.
Refer to Navigation and Features and Common Dashboard Features and Options as needed.
Click the ![]() (dashboard) button to navigate the detail
screen.
(dashboard) button to navigate the detail
screen.

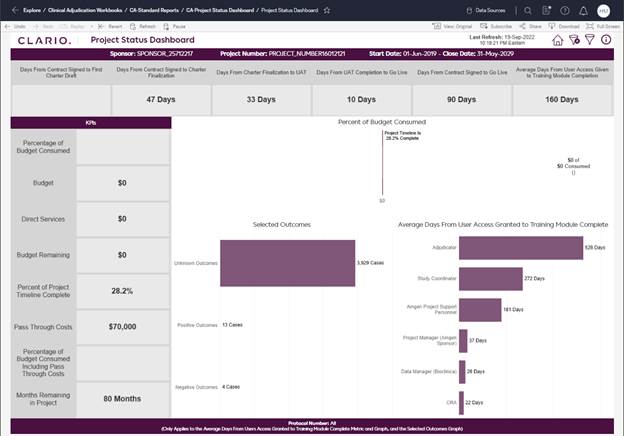
Figure 58: Click Dashboard Button and the Project Status Dashboard Displays
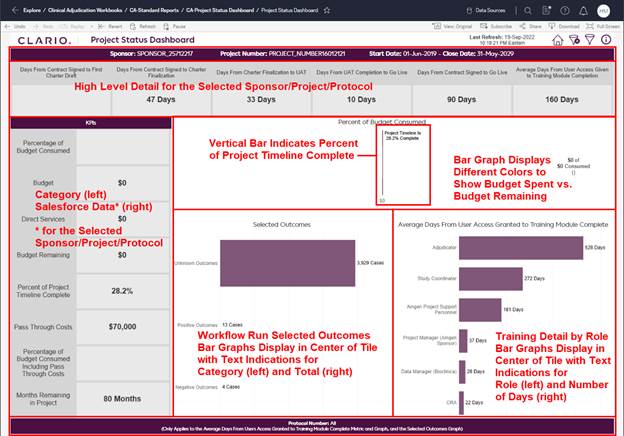
Figure 59: High Level Detail About Categories and Data that Display