When your permissions allow access to multiple Dashboards, select and navigate between options using the filter menu from a Dashboard screen. Some screens may display the filter menu opened by default. Refer to the Filter Dashboard Information (button) section for additional information.
1. On a Dashboard screen, click the ![]() (filter) button.
(filter) button.
2. The Dashboard Filters tile opens.
3. Select a date range option, options may vary based on your location in the system.
a. Click in a radio button to select a date range option, enter range in fields as needed.
b. Use the Slider Bar to set date range.
4. Open a drop-down menu and click on an option/check box/check mark to make a selection. Menu options may vary based on your permissions and location in this system.
a. Click in a check box to select an option; click on check mark to deselect an option.

Figure 2: Open Dashboard Filter
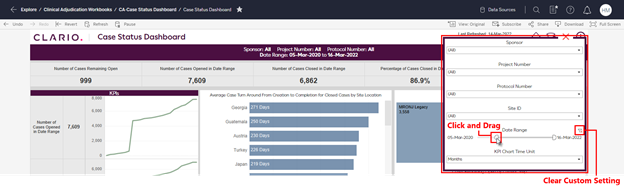
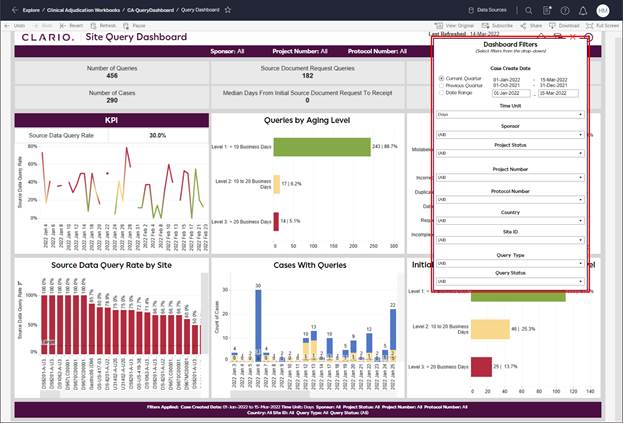
Figure 3: Dashboard Filter Examples
Related Topics
Launch Clario Clinical Adjudication Analytics