Key Performance Indicator (KPI) data is shown as a Trend Graph
on the
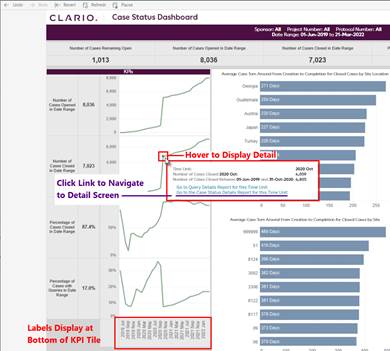
Site Query Dashboard and the Case Status Dashboard.
·
The tiles that display KPI data visualizations are
located on the left side of the screen.
·
Date labels display at the bottom of the KPIs tile
when applicable for the data.
·
Hover over a data point to display onscreen detail
for the metric when applicable.
·
The Metric Category information may display on the
right side of a graph.
Refer to the KPI
Data Display section for KPI filter
detail.
Figure 51: Key Performance Indicators (KPIs) – Info Displays Onscreen and Upon Hover
Related Topics
Common Dashboard Features and Options
KPI Data Display